12/11/2023
How to Read a Weather Map

Meteorologist
Weather maps are invaluable tools in forecasting weather conditions. They allow us to visualize complex meteorological data in a simplified manner. In this comprehensive guide, we'll delve deeper into understanding various elements of weather maps.
How to Read a Surface Weather Map
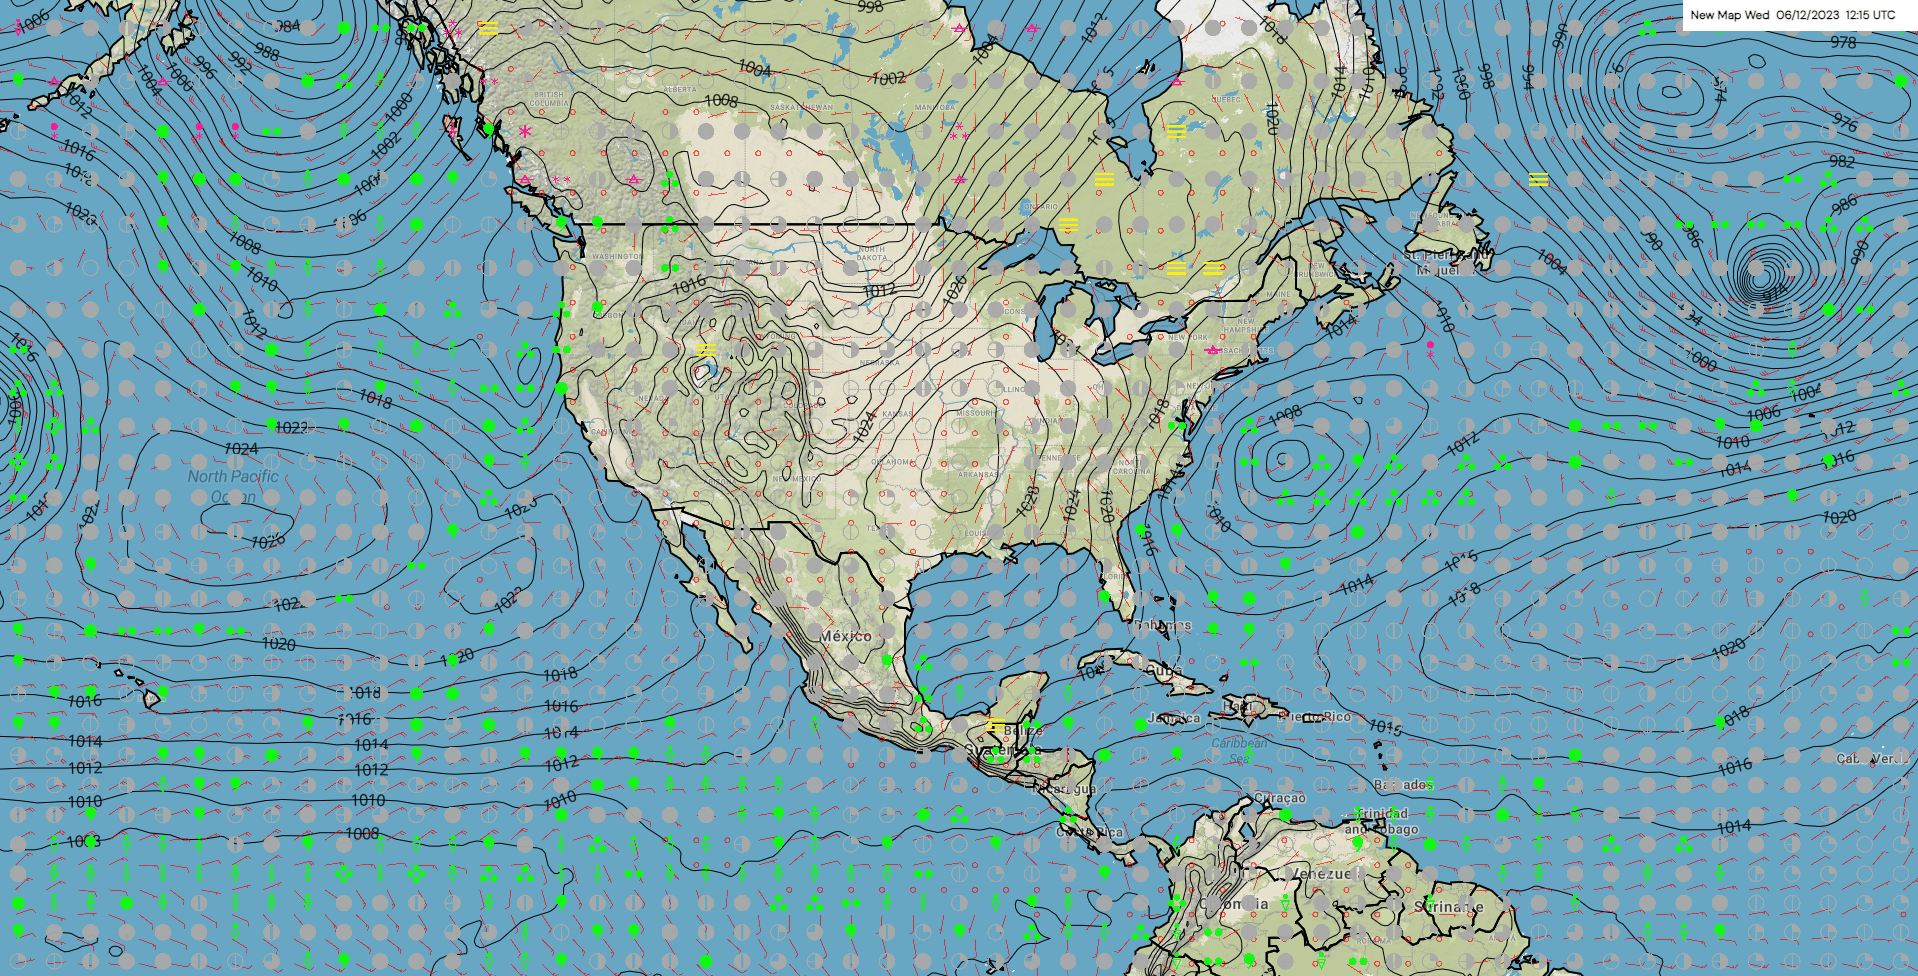
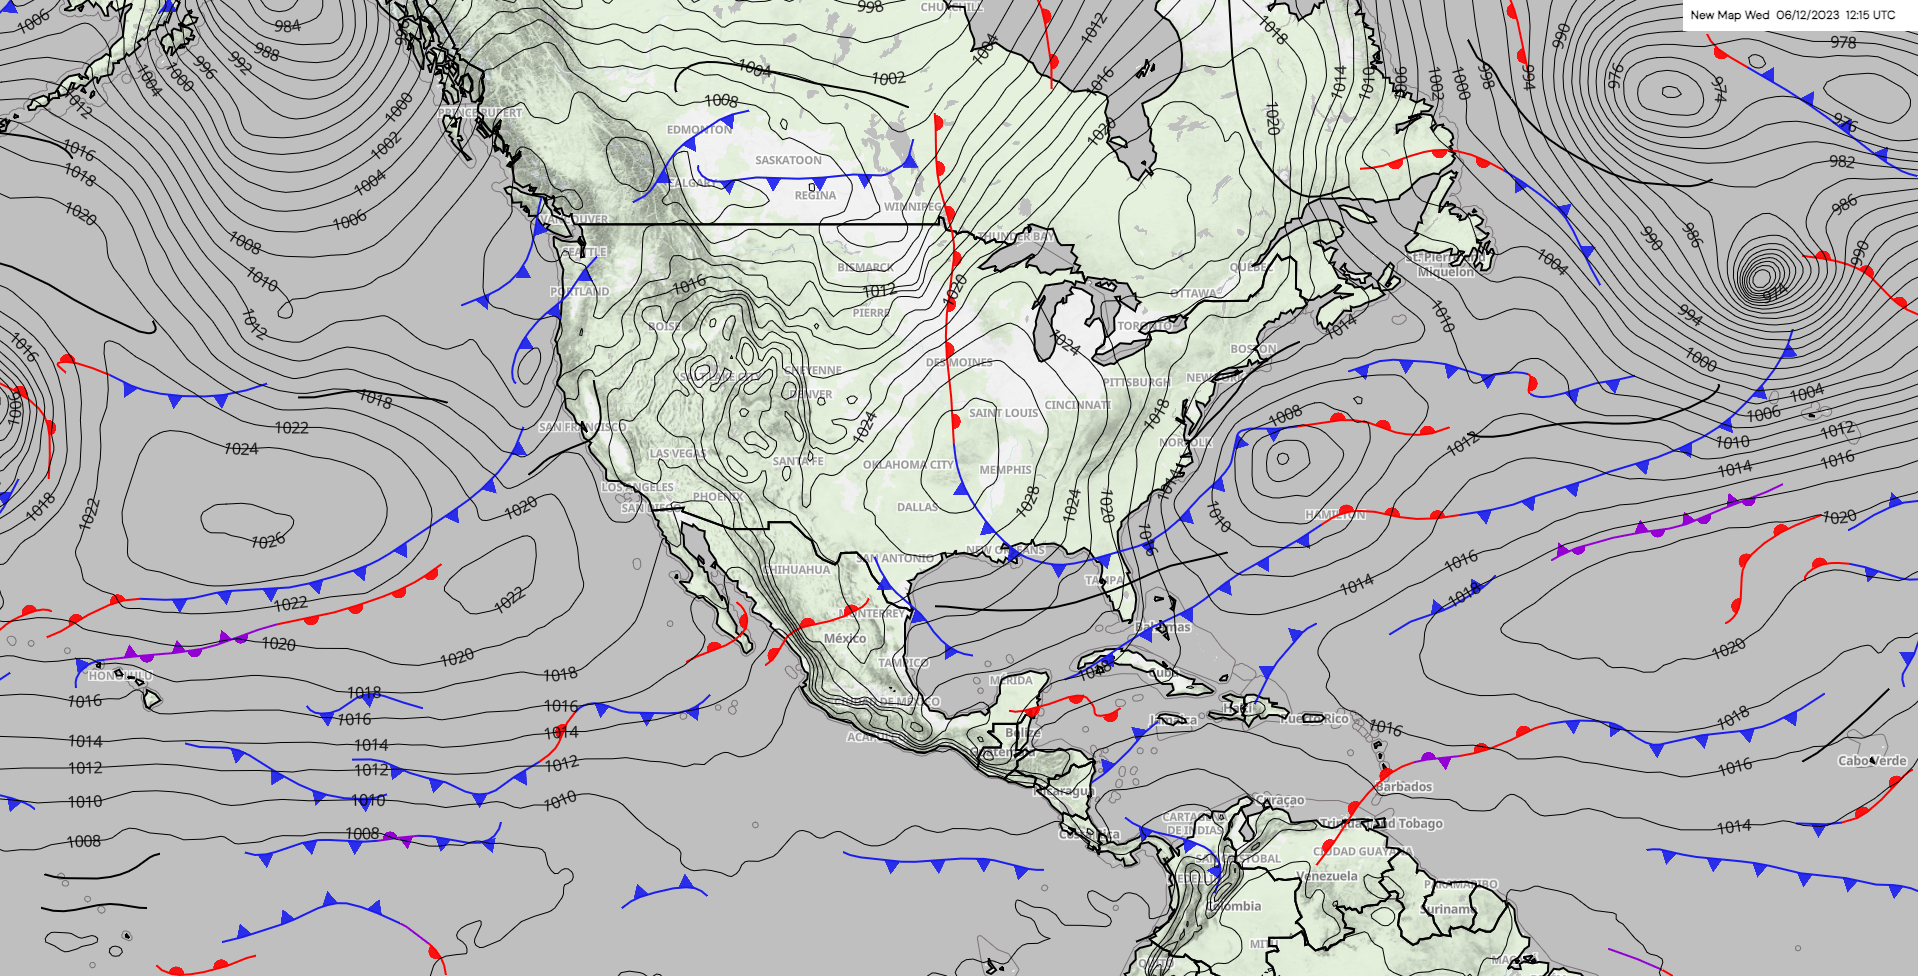
Surface weather maps provide a snapshot of various meteorological conditions at ground level. These maps include symbols representing different weather phenomena like rain, snow, and fog. For instance, dots represent rain, while asterisks signify snow. Additionally, surface maps show front lines, indicating the boundaries of different air masses and often the zones of most significant weather changes.
These maps also include temperature data, usually in the form of color-coded areas or specific temperature readings at various locations. Understanding how to read temperature data alongside other weather indicators is crucial for a comprehensive view of current weather conditions.

How to Read Wind Speed and Direction on a Weather Map
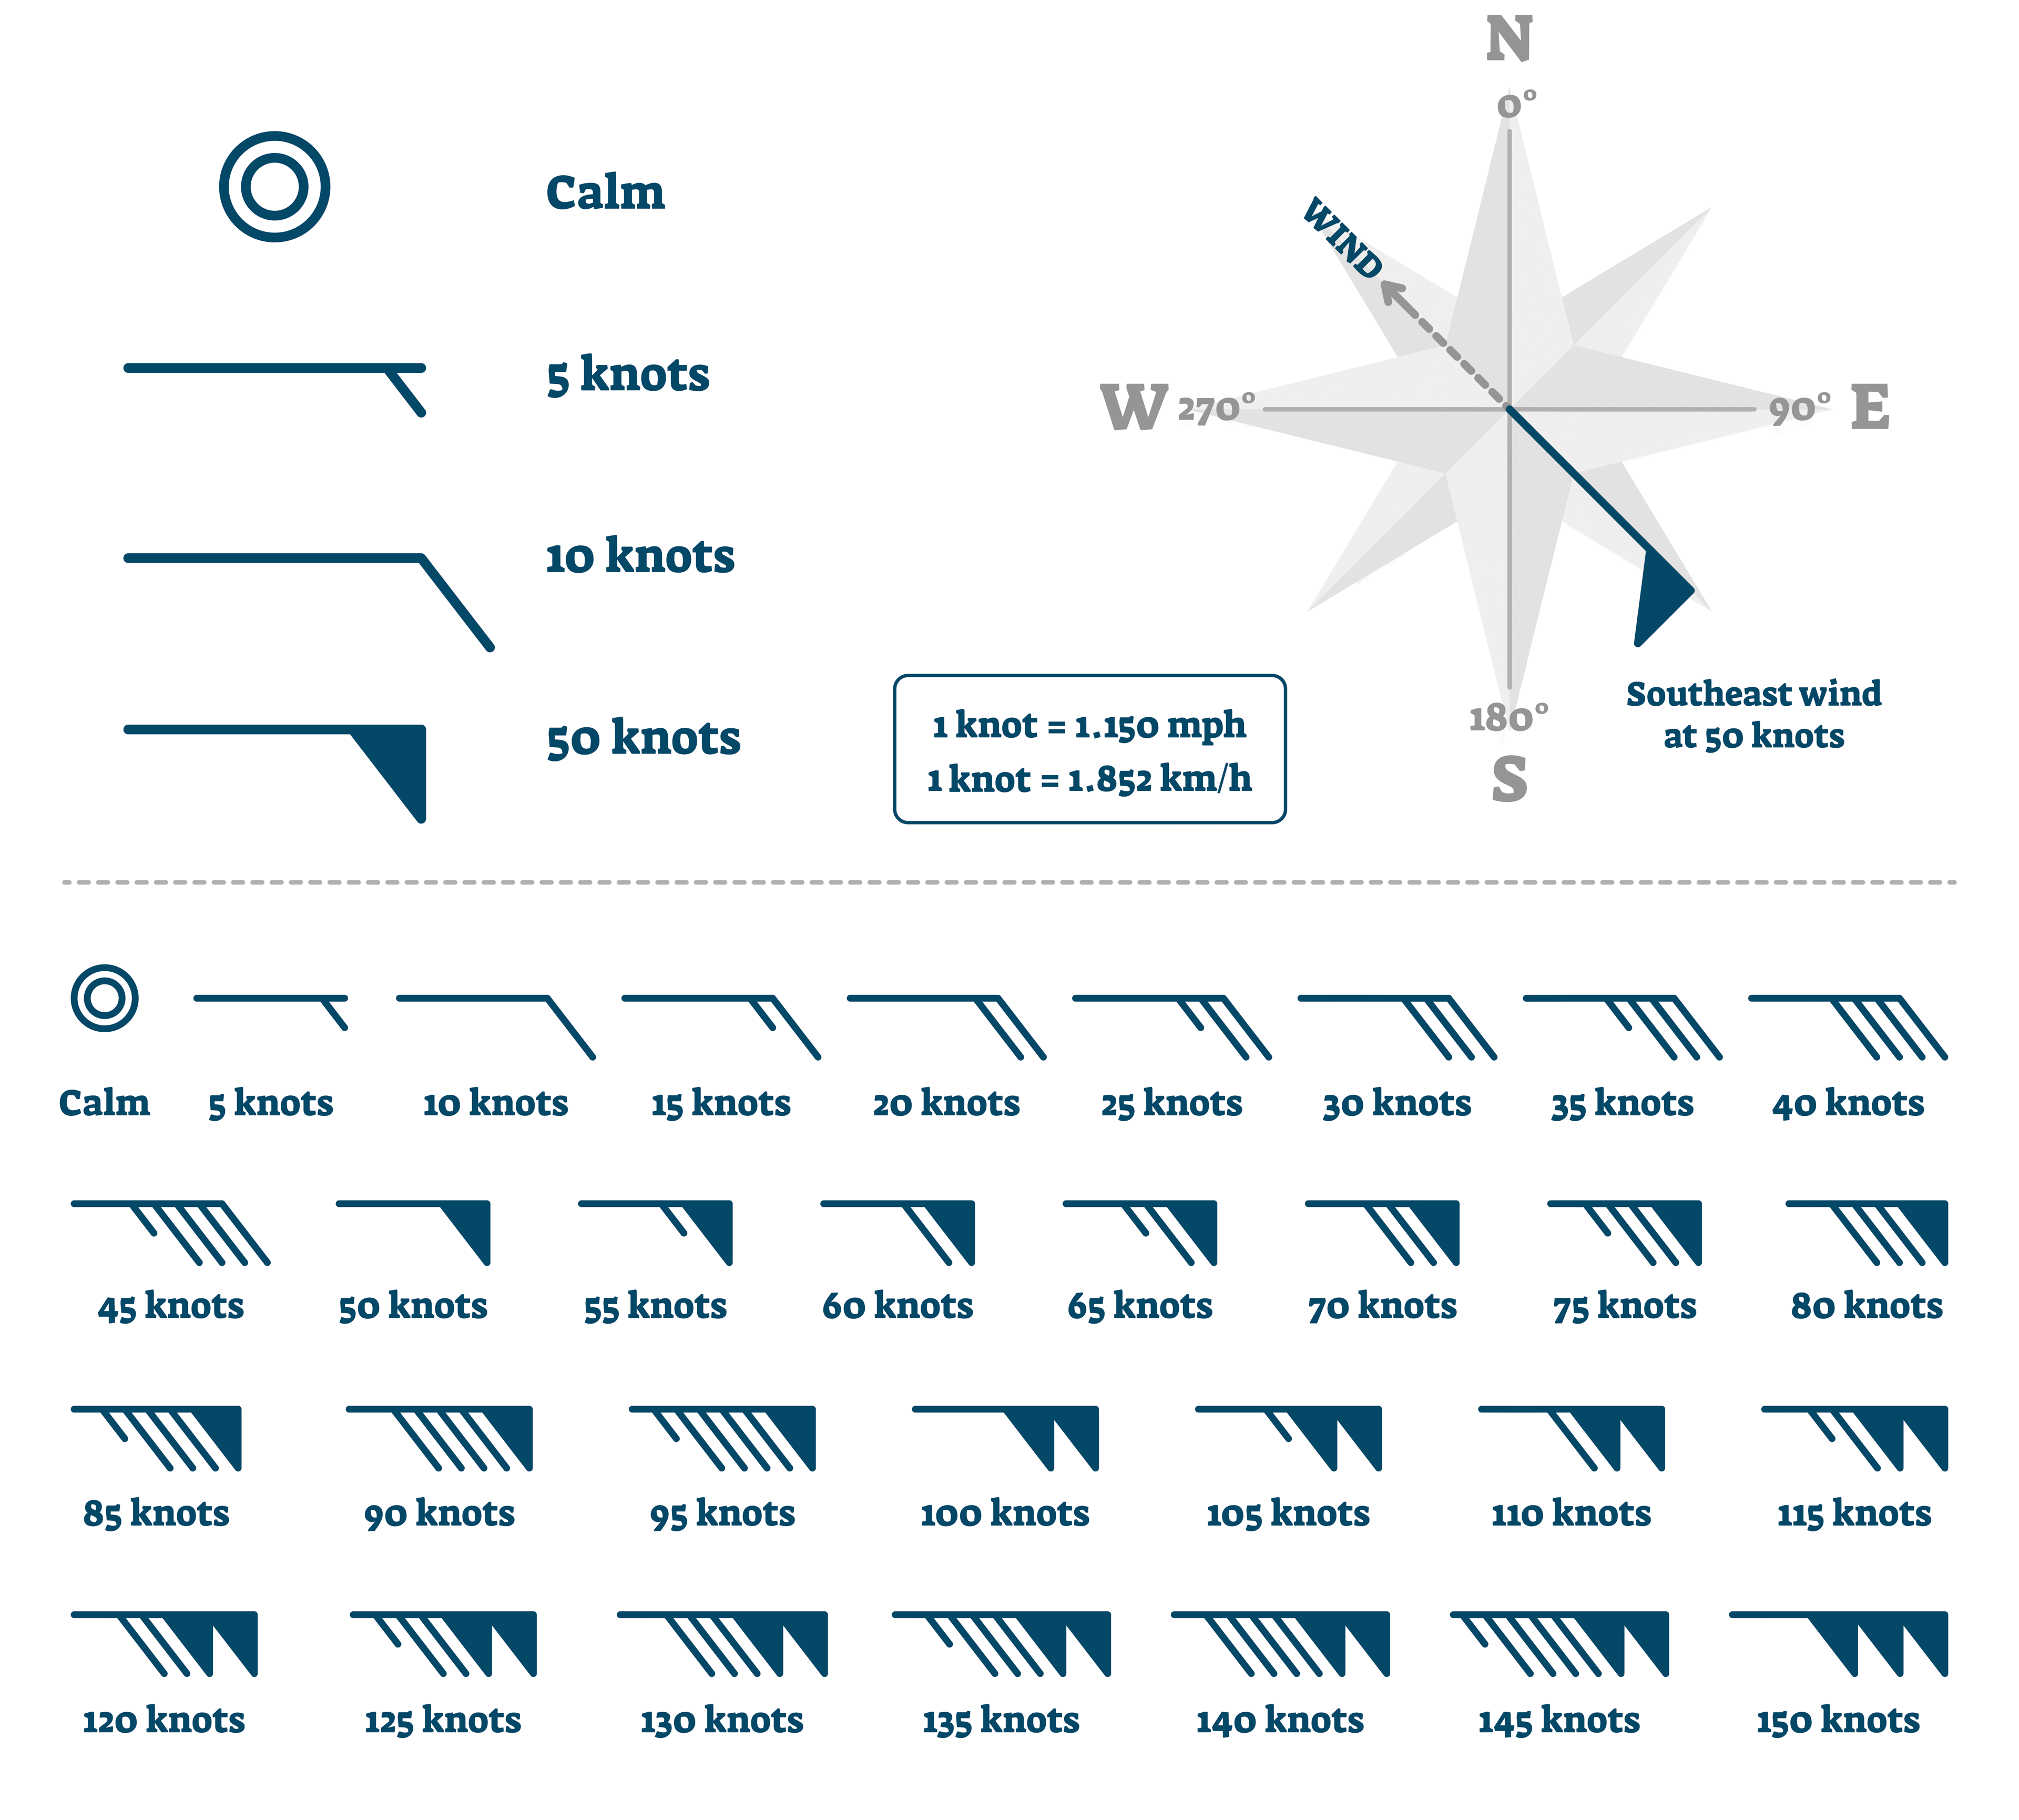
Wind speed and direction on a weather map are usually shown using wind barbs.
How to Read Wind Barbs on a Weather Map
Wind barbs provide detailed information about wind speed and direction. The staff of the barb indicates the direction from which the wind is blowing. Each full barb represents 10 knots of wind speed, while half barbs represent 5 knots.
In aviation and marine navigation, understanding wind barbs is critical for safety and efficiency. These symbols also help in identifying weather patterns such as high-pressure systems and cyclones.

How to Read Air Pressure on a Weather Map
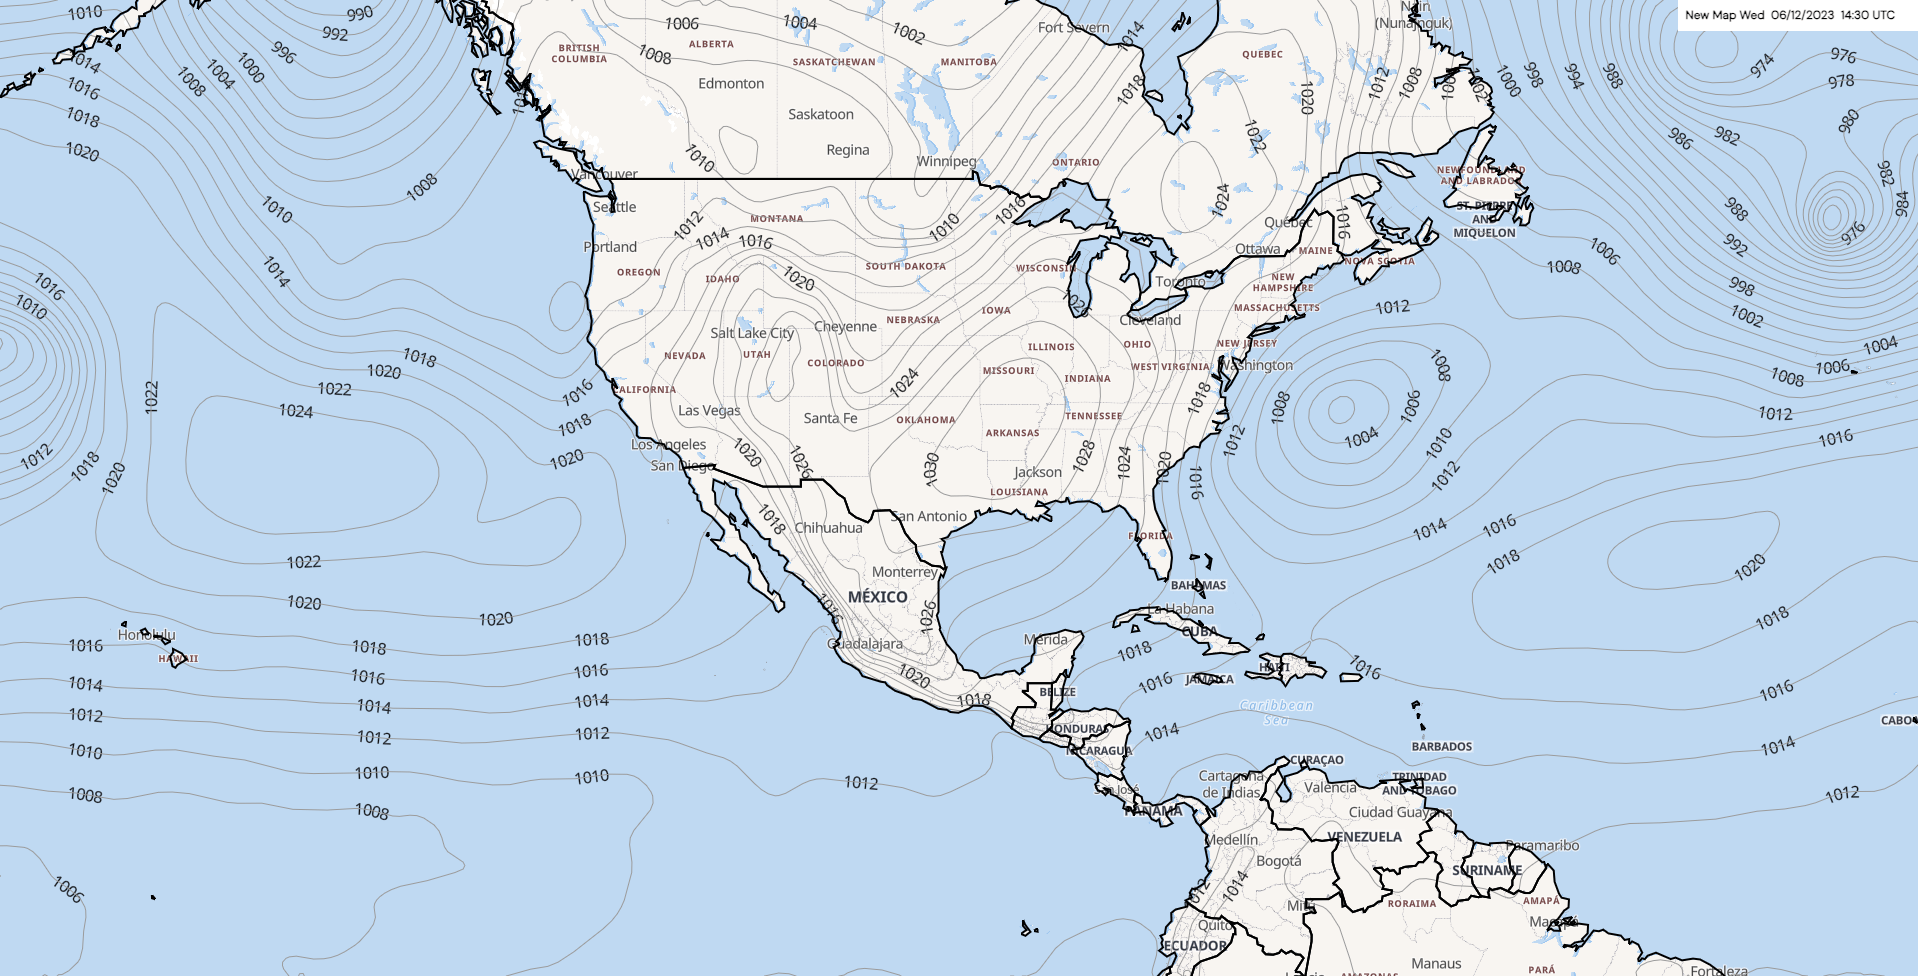
Air pressure on a weather map is usually shown using isobars.
How to Read Isobars on a Weather Map
Isobars connect points of equal atmospheric pressure and are key in identifying pressure systems. Tightly packed isobars indicate a steep pressure gradient, usually translating into high wind speeds. Conversely, isobars that are far apart suggest mild winds. By tracking the movement of isobars, meteorologists can predict changes in weather conditions, including the approach of storms or the onset of calm weather.
Isobars also help in identifying the centers of high and low-pressure systems. High-pressure systems, generally associated with good weather, are indicated by isobars that form closed circles with higher pressure values towards the center. Low-pressure systems, often bringing clouds and precipitation, show the opposite pattern.
How to Read a Radar Weather Map
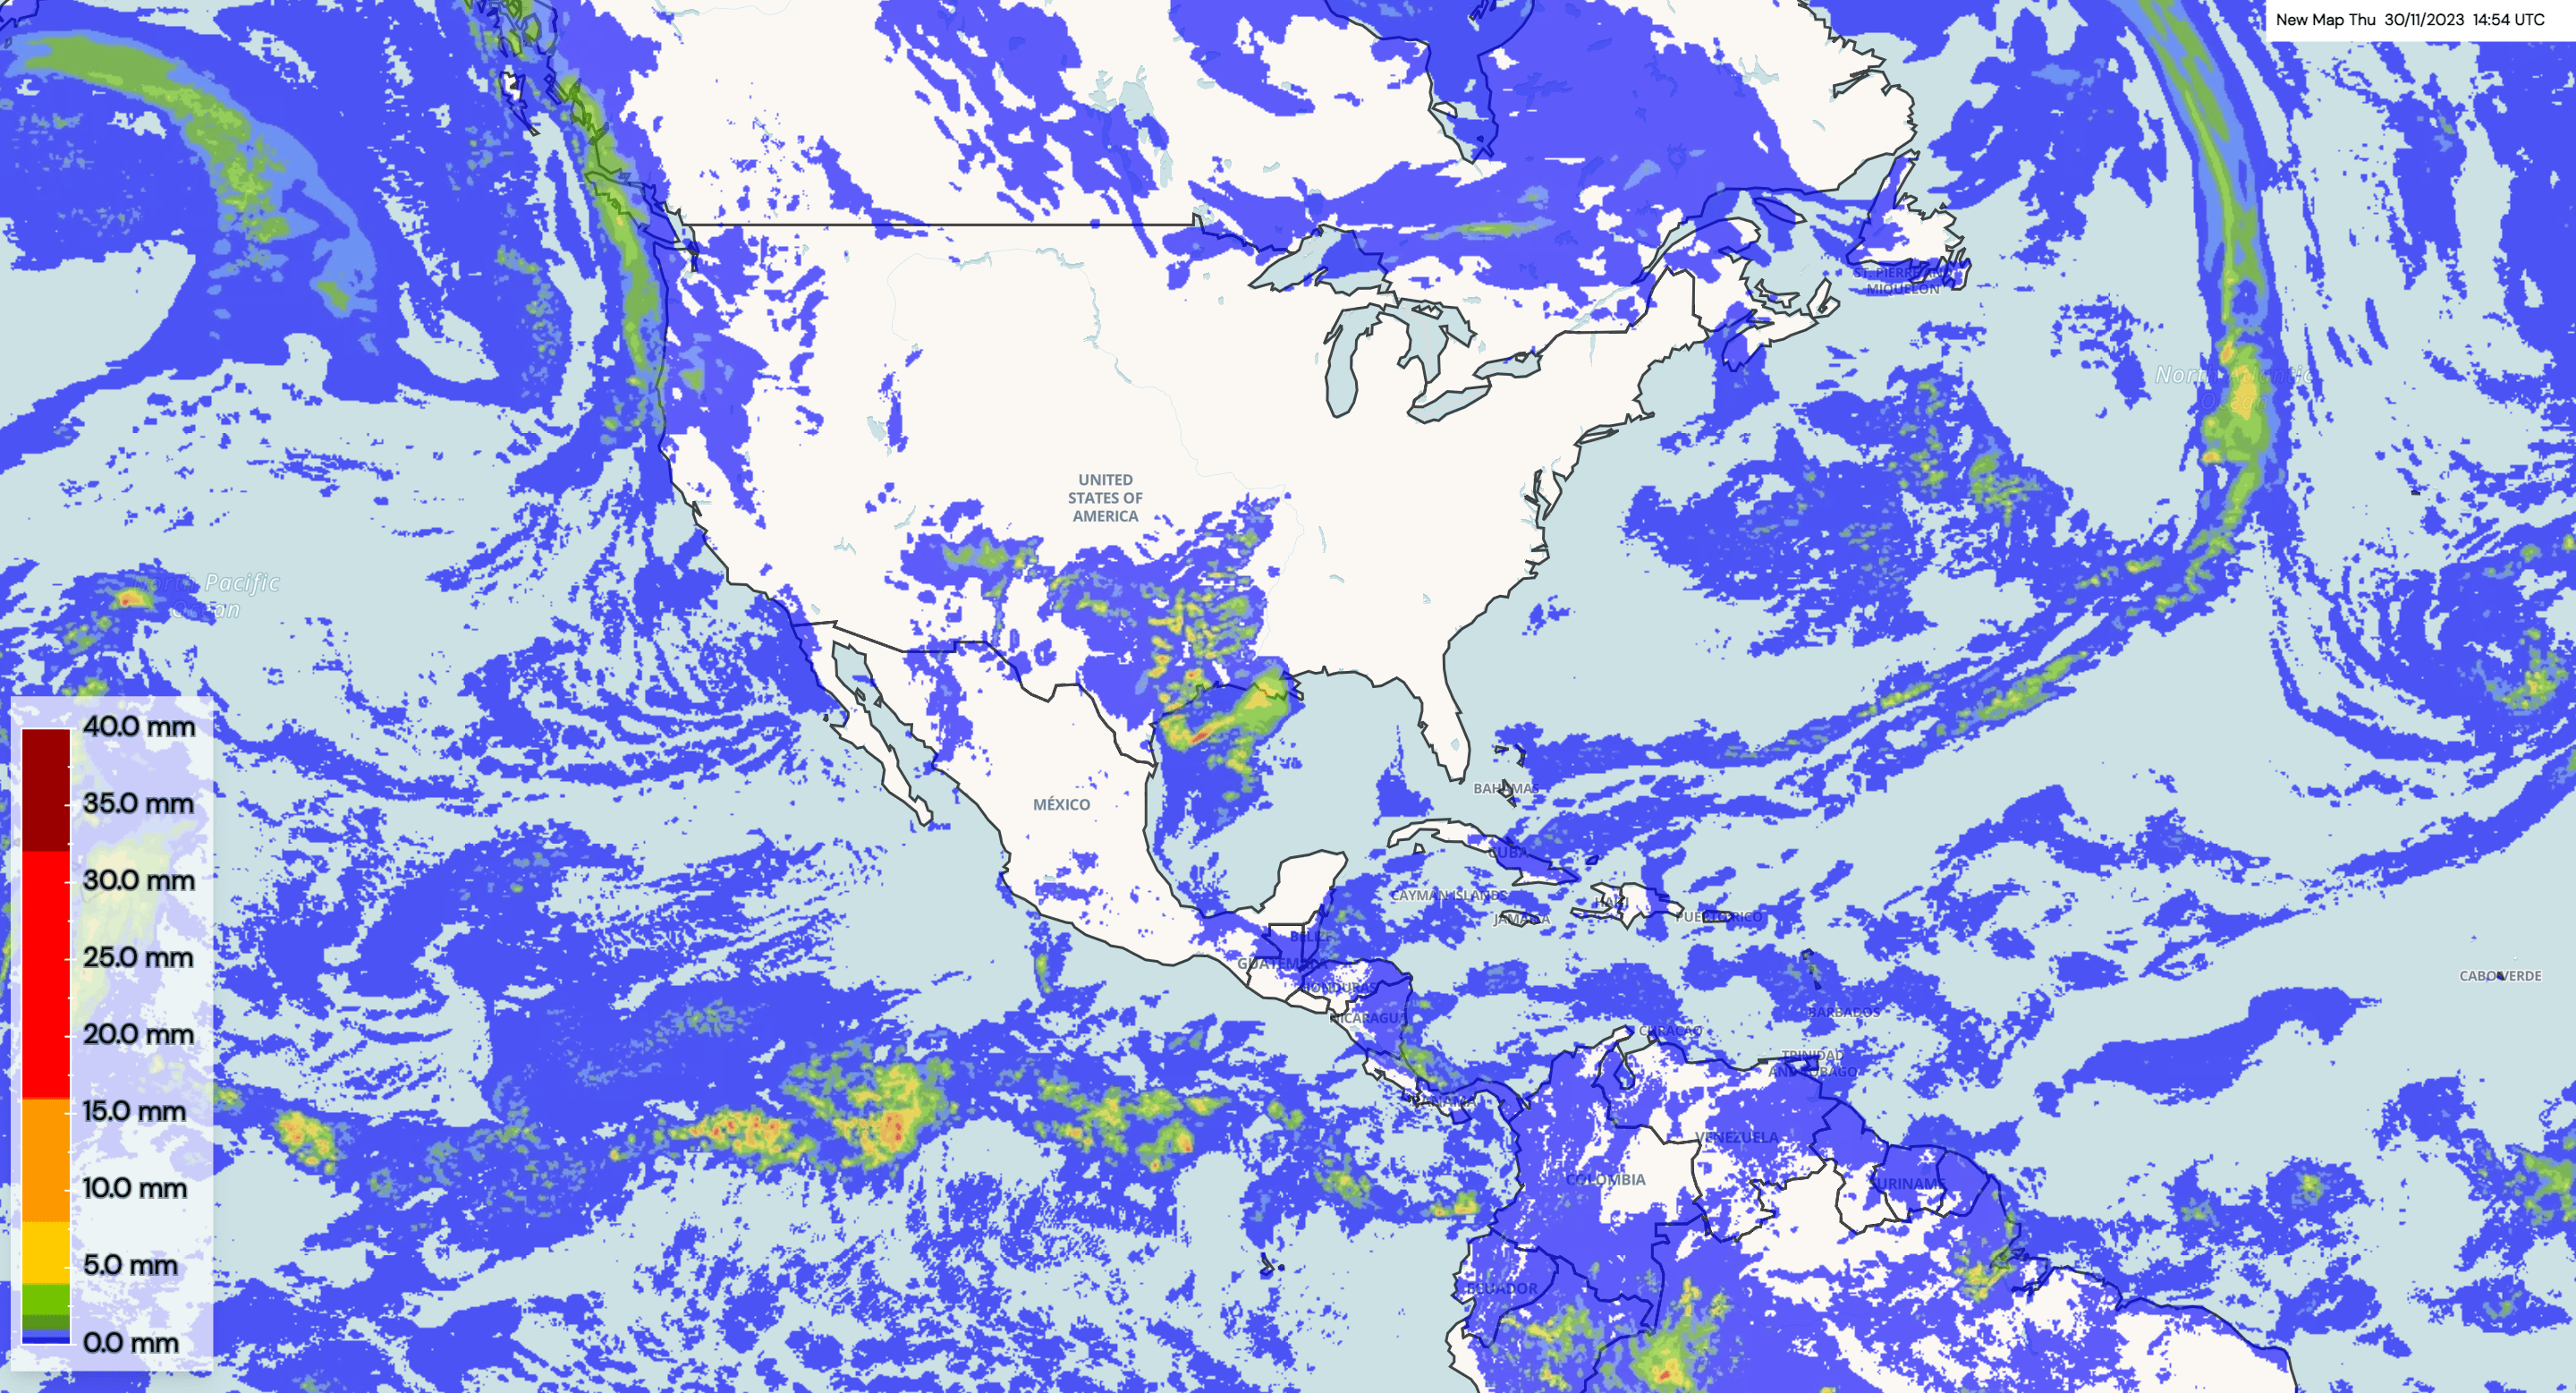
Radar weather maps are particularly useful for visualizing precipitation. They use color gradients to show the intensity of rainfall, snow, or other forms of precipitation. Light precipitation is usually indicated in lighter colors like green or blue, while heavy precipitation appears in red or purple.
These maps also show the movement of storm systems, which is critical for predicting the timing and impact of bad weather. For instance, a radar map can show the direction a thunderstorm is moving, helping in issuing timely weather warnings.

How to Read Fronts on a Weather Map
Fronts are depicted as lines with specific symbols that indicate their type. A cold front, usually bringing cooler temperatures and possibly storms, is shown with a line with triangles pointing in the direction of movement. A warm front, often bringing milder weather, is depicted with a line with semi-circles.
Understanding fronts is crucial as they are often associated with significant weather changes. For example, the passage of a cold front can bring a sudden drop in temperature and a shift in wind direction.
How to Read Cloud Cover on a Weather Map
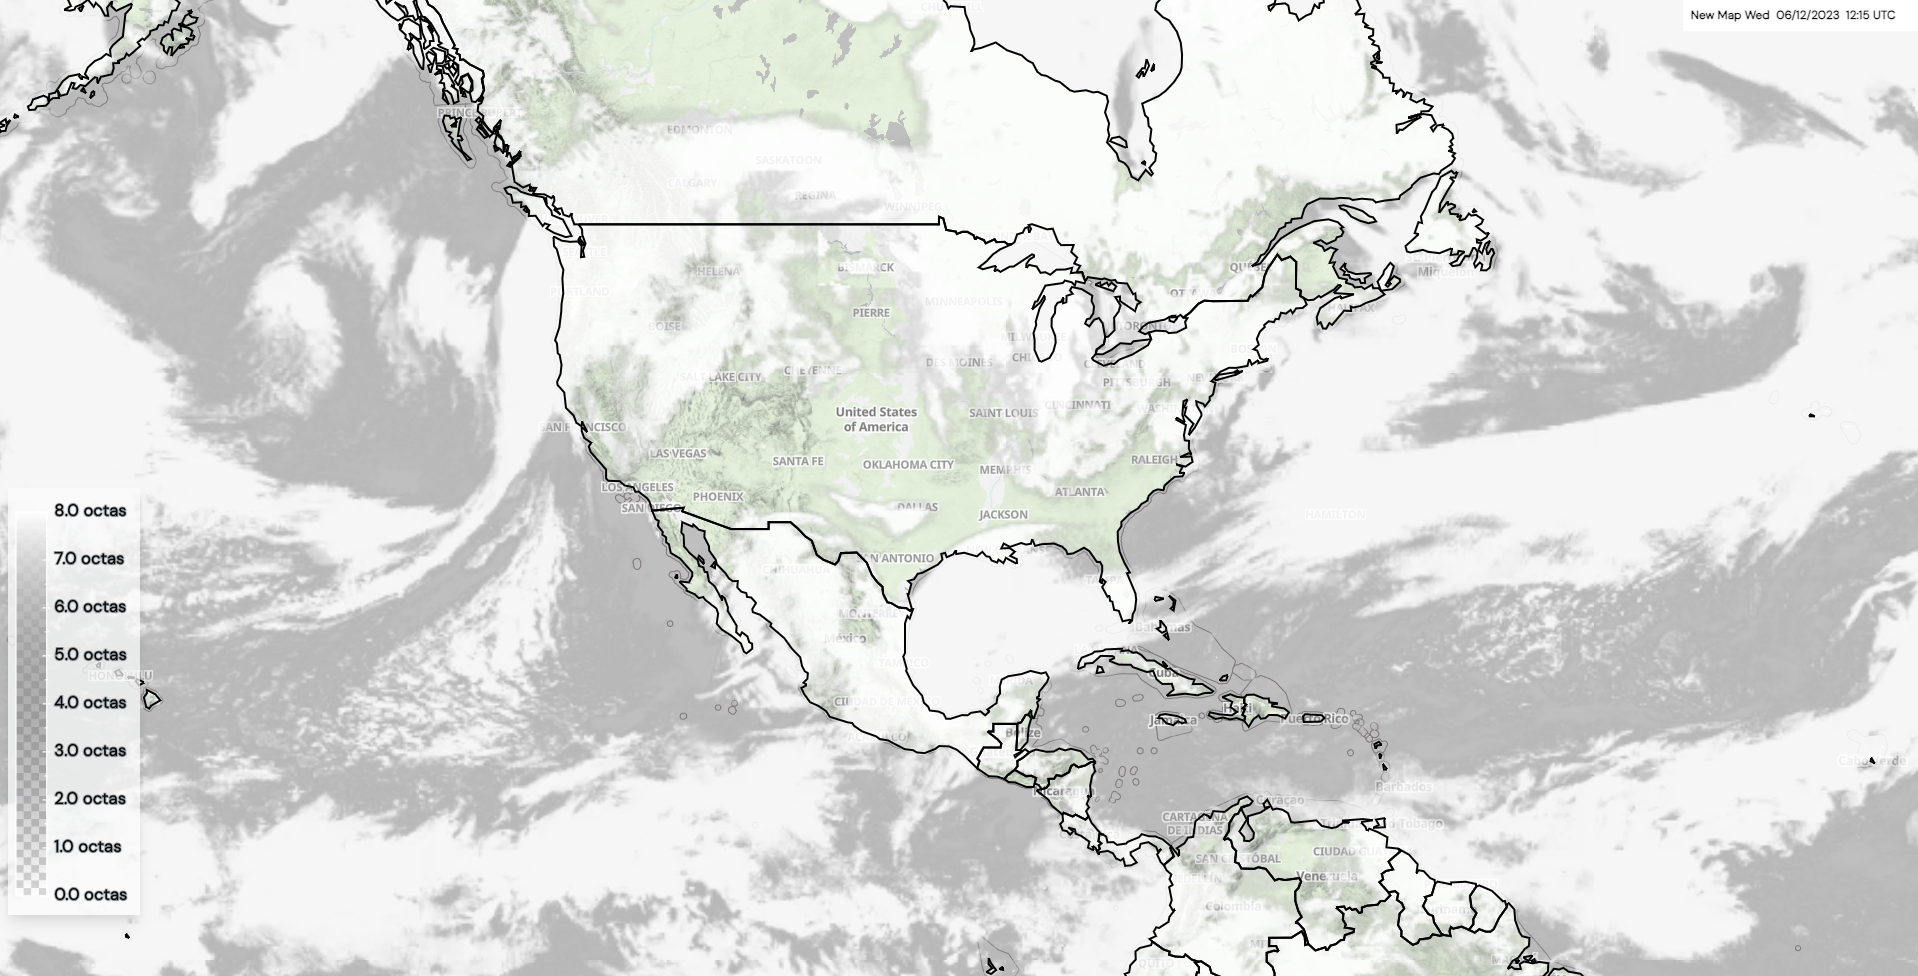
Cloud cover on weather maps is indicated by various symbols. A clear sky might be represented by a circle with a single dot in the middle, while a fully shaded circle indicates overcast conditions. Partial shading denotes partly cloudy skies.
Instead of using circles, some weather maps may depict cloud cover using cloud icons or images. A clear sky might be represented by an absence of clouds or a symbol with minimal cloud coverage, while fully shaded cloud icons indicate overcast conditions. Partial shading or the presence of scattered cloud images suggests partly cloudy skies.
Cloud cover data, combined with other weather information, can also help in predicting precipitation and temperature changes.
How To Read Ocean Currents on a Weather Map
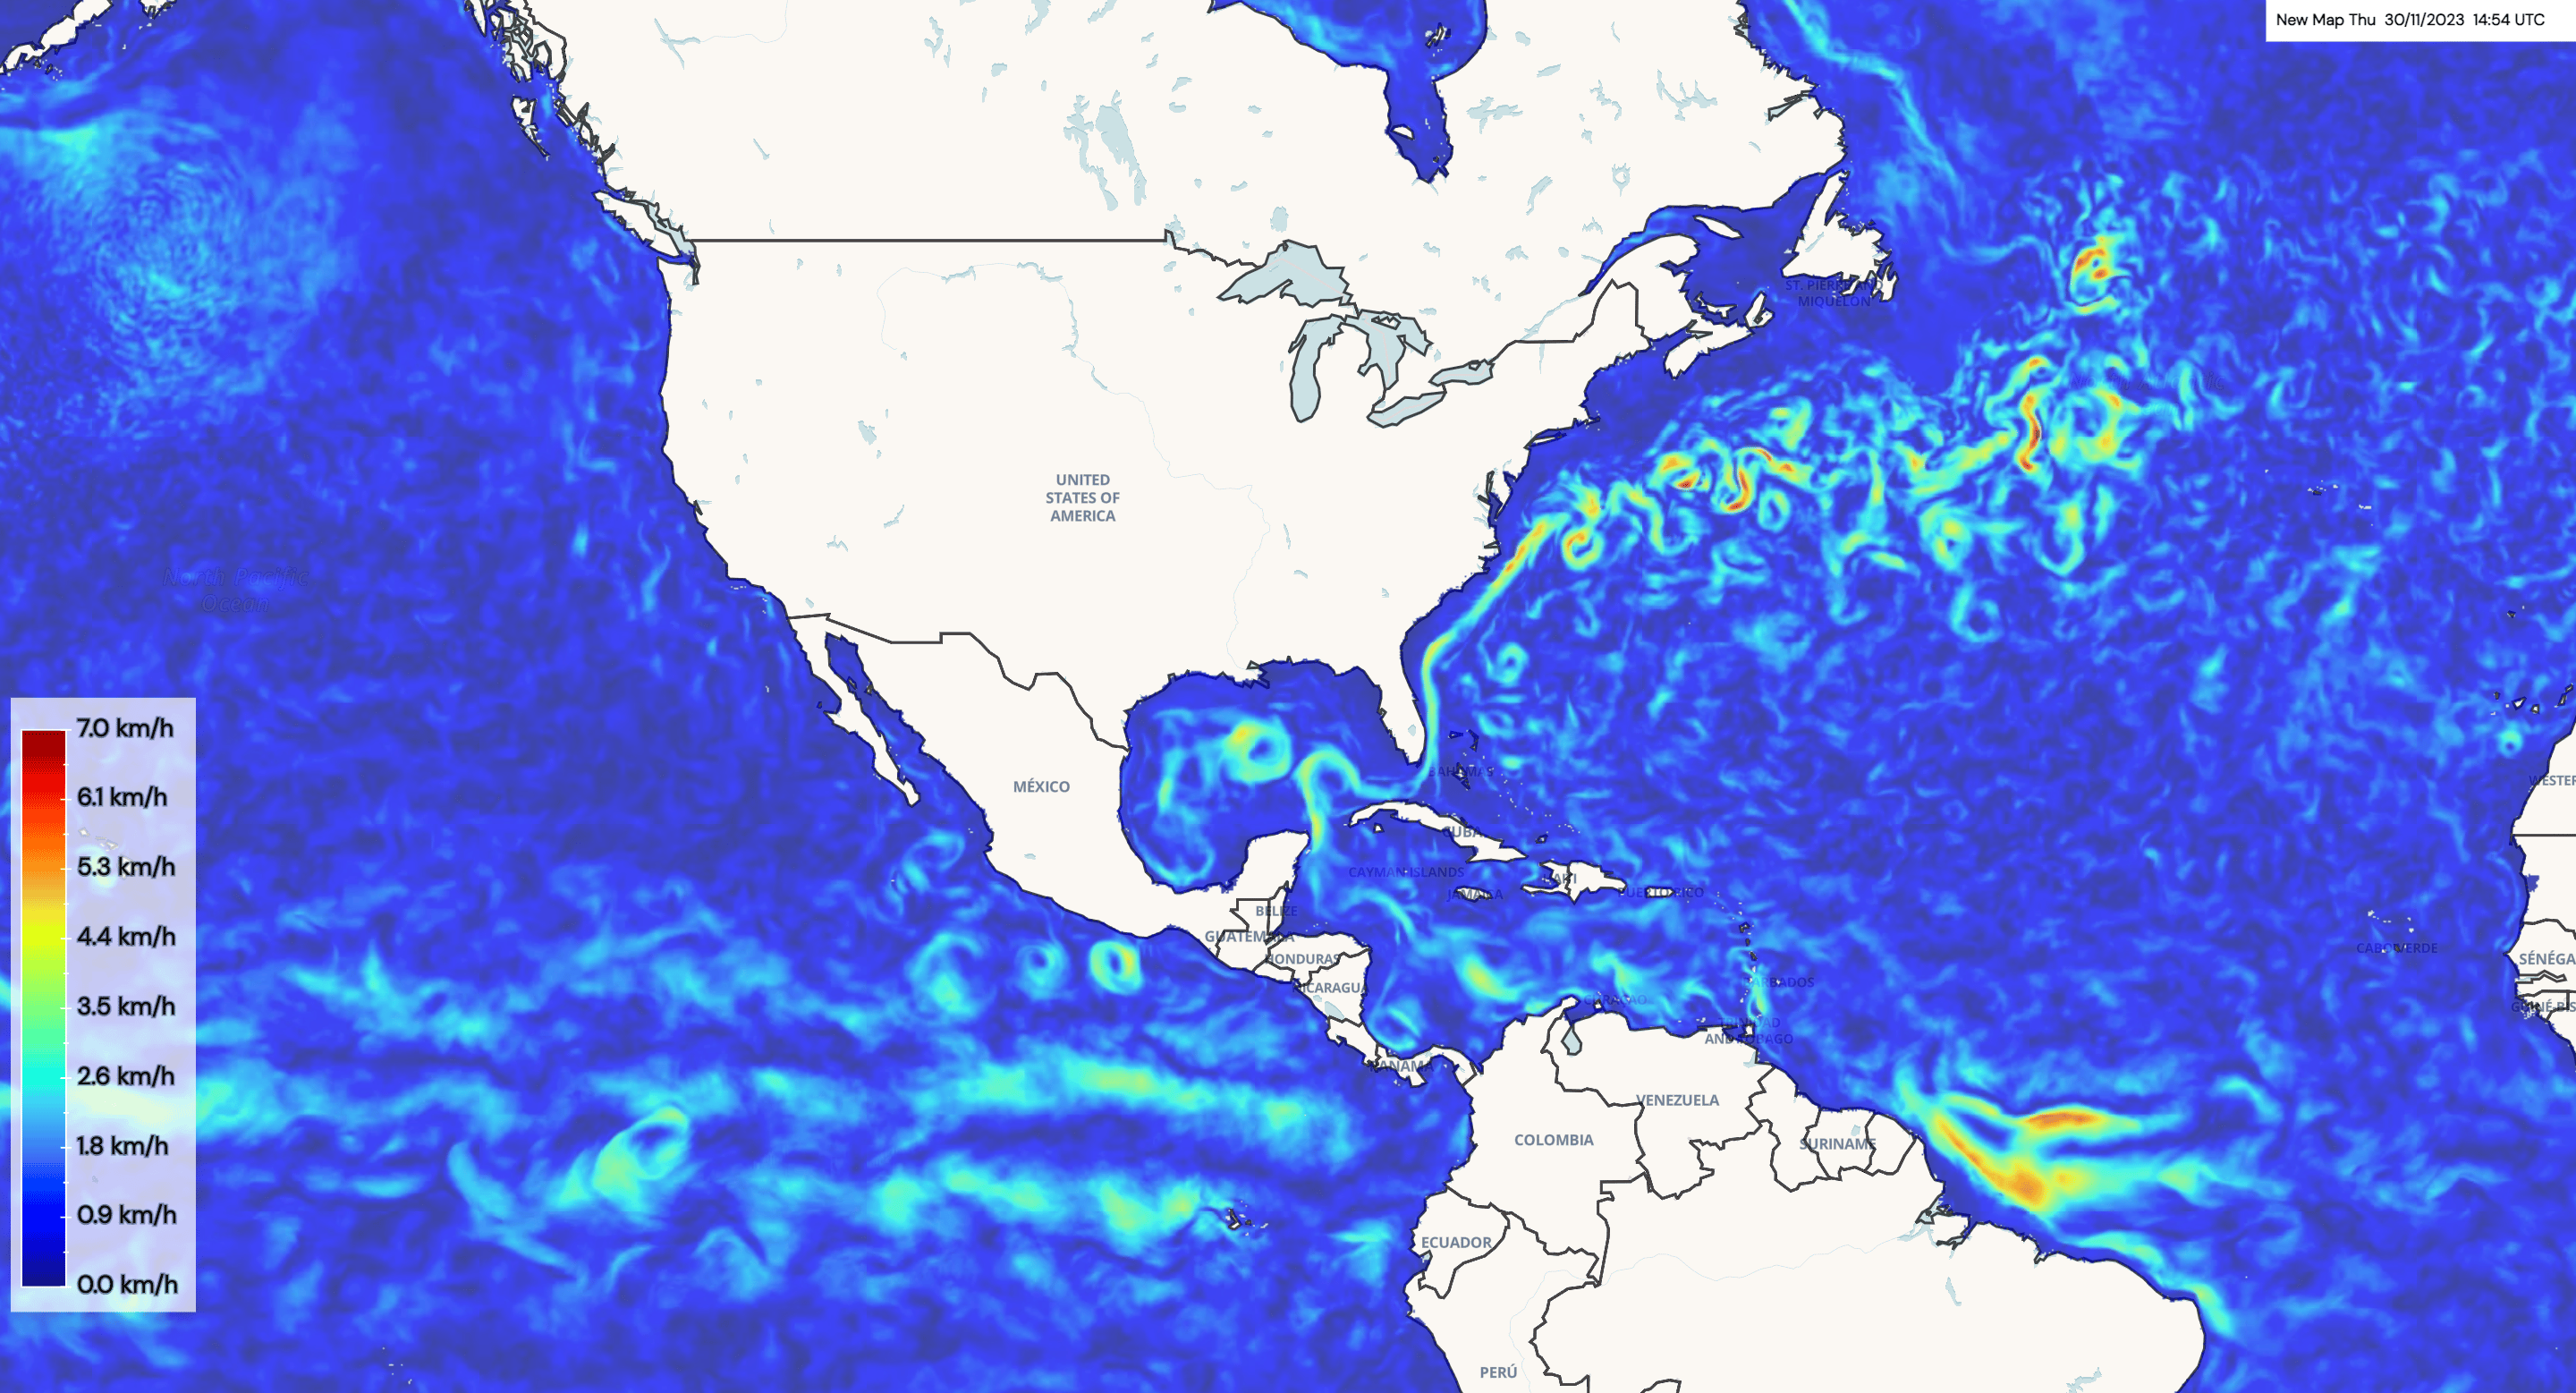
To decipher ocean currents on a weather map, look for color gradients that represent the direction and velocity of water movement in the Earth's oceans and seas. While some maps use arrows or flow lines, others utilize color variations to convey this information. The color orientation signifies the current's flow direction, with warmer hues indicating one direction and cooler hues denoting another.
Moreover, the intensity of the color gradient, ranging from gentle transitions to more abrupt shifts, provides insight into the current's speed — gradual transitions represent slower currents, while sharp changes indicate swifter flows.
Mastering the interpretation of these color-coded representations is essential for comprehending ocean dynamics and their influence on various aspects, from marine navigation to climate patterns.
How To Read Temperature on a Weather Map
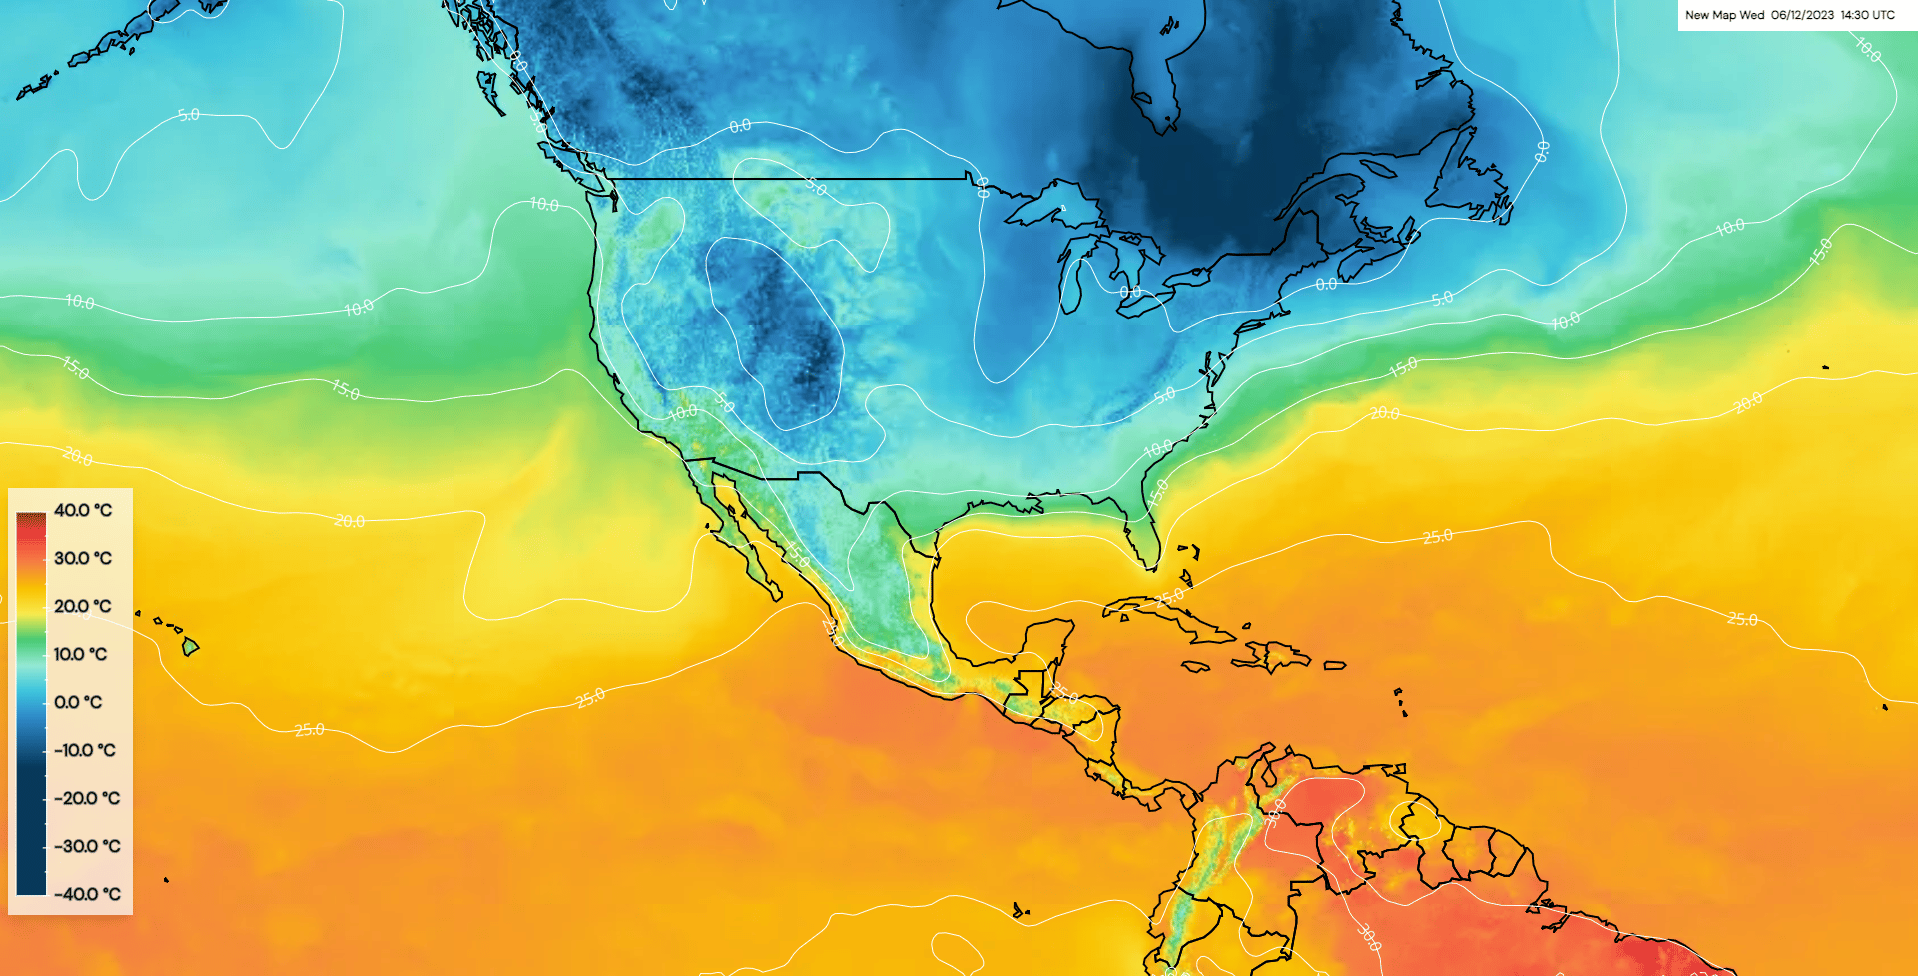
Typically, temperature information is represented using color shading or contour lines. Warmer areas are depicted in shades of red, orange, or yellow, while cooler regions appear in shades of blue, green, or purple. Each color or contour interval corresponds to a specific temperature range.
By comparing these temperature patterns, meteorologists and weather enthusiasts can identify temperature gradients and variations across a geographical area.
Additionally, isotherms, which are lines connecting locations with the same temperature, provide a detailed view of temperature distribution.
Looking for a Weather Map Solution?
Understanding how to read various elements on weather maps is crucial for accurately interpreting and forecasting weather conditions. Meteomatics provides tools and resources that enhance the understanding and application of weather data, aiding in a range of sectors from agriculture to transportation. By mastering these concepts, one can make informed decisions based on comprehensive weather analysis.
Meteorologist
Do You Have Any Questions About MetX?
Please complete the following form and we will get back to you shortly!
Related Articles

We provide the most accurate weather data for any location, at any time, to improve your business.